
This article is the second in CVB's "2020 Vision: What Does Operational Excellence Look Like?" roundtable series. See the first article here.
In The Tyranny of Metrics (Princeton University Press, reprinted 2019), Jerry Muller spends 200+ pages examining the problems that follow from “metric fixation” in a variety of fields, including healthcare. Metric fixation, he writes, is “the seemingly irresistable pressure to measure performance, to publicize it, and to reward it, often in the face of evidence that this just doesn’t work very well.” Muller is careful to point out that the issue isn’t with metrics on their own, but rather with “excessive measurement and inappropriate measurement.”
Measurement is in fashion, he writes, “frequently embraced as the silver bullet that will solve problems in education, medicine, policing, and other public institutions.” By collecting masses of metrics data—a task that technology has made easier and less expensive than ever before—and sharing it widely in the name of transparency, we are devaluing “judgment based upon experience and talent,” Muller contends.
There’s also the reality that healthcare in general, and cardiology in particular, has masses of data pouring from countless streams into its many buckets. Love it or loathe it, there’s a digital revolution transforming healthcare and it is dropping dilemmas of all sorts onto the laps of everyone in healthcare: clinicians, administrators, payers, policymakers and patients. To not analyze the wealth of data in healthcare could squander opportunities to do a lot of good for many people, some of whom really need help and haven’t been well-served in the past. (Check out the cover story for a few examples of how hospitals and health systems are leveraging their data troves in creative ways.)
In these two perspectives lies the dilemma of whether to approach healthcare’s masses of data as beautiful bounty or beastly burden. There also is the question of whether the ability to analyze all of this data not just descriptively but diagnostically, predictively and even prescriptively is distracting healthcare’s leaders from their really important work—taking care of people. How you view the beautiful beast likely depends in part on where you are positioned in the medical enterprise.

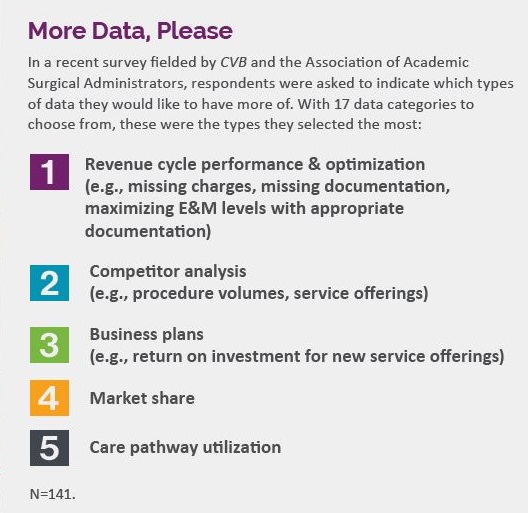
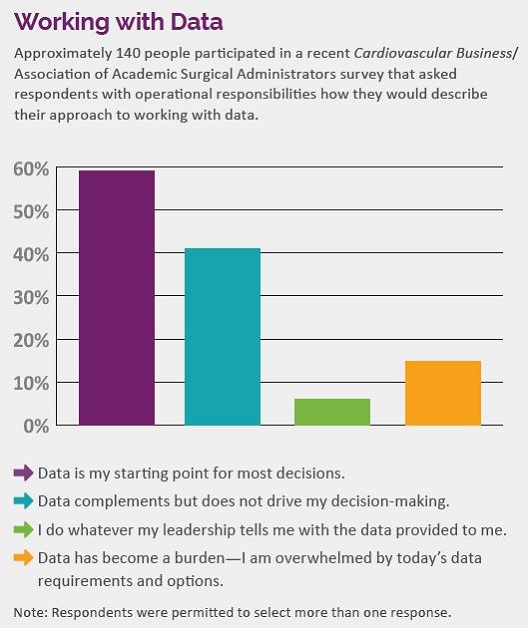
To get the operational perspective, CVB worked with the Association of Academic Surgical Administrators to host a roundtable discussion with service line leaders about the opportunities and challenges they encounter around data. As moderator, Greg Kharabadze, MHA, who has held service line leadership roles at the Cleveland Clinic and UC San Diego Health and now is at Yale University School of Medicine, asked panelists from organizations at different points on their data journeys to share approaches they’ve seen succeed and fail. That Kharabadze had read The Tyranny of Metrics is clear. He pushed the roundtable participants to respond to some of Muller’s points—such as how to avoid falling into the “numbers game” trap and how to avoid scenarios where clinicians resent the metrics-based goals that practice administrators think are important. Their thoughts are revealed in the excerpts below.
For readers skeptical about whether administrators’ hearts are in the right place, the conversation should be reassuring. “Focus on quality and doing the right thing,” each panelist said in his own way, “and everything else, including the financials, will flow from there.” In their recommendations on how to lead with data (vs. being led by it), it’s clear they’re working hard to use metrics not as instruments of tyranny, but as tools to support their teams, further their institutions’ goals and contribute to patients receiving quality care.
Invest in data validation—no shortcuts allowed
Kharabadze: What do scientists, researchers, clinicians and administrators mean when they talk about data analytics?
A literature review reveals that data typically are bucketed into four group. First, descriptive data focusing on what has happened—such as the information we ferret out from dashboards and scorecards. Second is diagnostic data, which we use to analyze why we got certain outcomes. From there, we progress to predictive analytics, where we use our descriptive and diagnostic data to forecast what will happen next. And, finally, once we know what happened, why it happened and what is likely to happen next, we can use prescriptive analytics to help determine what we should be correcting or accelerating to achieve our business imperative.
I suspect most of us spend our days focused mainly on descriptive analytics, so let’s start there. How are you approaching this task, and what are some problems you encounter in the descriptive analytics space?

Administrator of Cardiovascular Medicine at the Cleveland Clinic in Ohio
McMahan: At the Cleveland Clinic, we have many different dashboards that provide information about our past performance. Whether you are measuring volume, activity or financial performance, for example, you need to know what happened.
In this arena and in my role as the administrator of cardiovascular medicine, I’m essentially a consumer. I’m studying the descriptive data to understand what the organization has done and how well we’ve done it. Our stakeholders value this information because it allows us to set the direction for where we’re going, and it allows us to look at strategies to correct our course.
Vallejo: One of the challenges we face with descriptive data is validation. There must be a mechanism and a process for confirming the data is correct. Early on, I was finding errors related to our data collection. We need to ask whether we are using the right descriptive fields and if everyone is collecting and inputting data in the same way.
The other key point with descriptive data is how we’re using the data. In my case, I’m often presenting our data to different stakeholder groups. I remind myself that most physicians think differently from MBAs. As administrators, we need expertise in thinking through who the audience is and how to present the data appropriately. If it needs to be simple, is it simple? Have I drilled down deep enough for an audience that needs detail?
The main points with descriptive data are, first, take the time to validate and, second, prepare it appropriately for each audience.
McMahan: I agree, the validation process is key to success no matter what you’re going to try to interpret from your statistics.
Kharabadze: I think we all agree the easiest way for administrators to lose the confidence of our clinicians is to present data that is incorrect or, even worse, that makes no sense from the clinical perspective.
Related to that point is data governance, both organizational and departmental. Where are your organizations with data governance?
Senior Clinical Administrator for the Department of Surgery at Texas Tech University Health Sciences Center El Paso
Vallejo: Our medical school was established in 2007, so it is quite new. We have two EMRs, which isn’t uncommon for growing institutions. We’re in our infancy as far as data governance. I participate in one of our committees that is focused on data—security and safety mostly. We’re looking at other institutions’ policies and procedures on data-gathering and governance.
McMahan: Clearly, the Cleveland Clinic is a large enterprise with many key areas that manage the data that our people have access to. For example, the business intelligence area manages most releases of data, IT security looks at all the data that comes into the organization and the IT governance committees are involved in managing which data the different groups are collecting.
Before any information is shared outside of the organization, it goes through a screening process to confirm it is accurate, validated and strong. Our governance process is set up to ensure the integrity of the data—that it is sound, reproducible, managed and secure.
These days, we have one strong EMR product that allows communication and data-sharing across the whole organization and with external parties. We make sure we have the correct IT infrastructure in place, including firewall protection and how the cloud is being used. Those components become very important when you’re sharing data with others.

Director of Cardiovascular Services at UC San Diego Health
Sivagnanam: At UCSD, there’s been a proliferation of dashboards for different service lines. One of my contributions to the cardiovascular service line dashboards in terms of data governance was testing everything thoroughly with all of the key stakeholders to make sure the data held true. From then on, I’ve had a monthly call with our information services partners to review our dashboards. Th at way we’re quickly on top of any issue that anyone on the team spots. The point is regular review and validation.
Kharabadze: The scenario at Yale is slightly diff erent from those at many organizations.Yale New Haven Hospital and Yale School of Medicine are legally separate entities.
It is a fairly atypical situation that creates challenges in terms of the legality of data exchange. We must ask, “What are we legally allowed to exchange between the two parties?” The complexity is expanding as we grow as a health system.
Our data governance model is managed by the Joint Data Analytics Team (JDAT), which was created to address the reality that two different people might be looking at the same data but pulling from different systems and arriving at two different answers—sometimes radically different answers. Th is is not helpful when you’re trying to build a sound business proposal.
In terms of data governance, it affects almost any project where a department wants to use data—for example, building a dashboard with quality, patient access and experience, financial performance and so on. Our process is that both sides come to JDAT together to confirm that our understanding of the relevant data are the same.
Follow your patient-centered data; the dollars will follow
Kharabadze: In The Tyranny of Metrics, author Jerry Muller warns against data analytics becoming “a numbers game,” particularly in healthcare. He points out how often administrators say that healthcare needs to be run as a business.
What are your thoughts on how we talk with our clinician colleagues about data? Do you stop with the data, or do you use it as a tool for partnering with your clinicians? How have you made the connection from the scorecard or dashboard to something meaningful for at-the-bedside care?
Sivagnanam: As administrators, we’re sometimes accused of just looking at the financial aspects of healthcare. I try to focus on the financial aspects and the clinical quality outcomes and use them together to show how both categories of data can help, for instance, in running procedural labs. Another way to dispel concerns is to provide accurate, real-time data that assist your clinicians in their quality meetings or with presentations they’re giving at conferences.
We can show our physicians blinded operator data so they can see for themselves what’s really going on and how they’re doing as a group and individually. I’ve found it helps to invite them in to look at the data often, review it together and then act on it. We can show (vs. tell) them what we can accomplish with good data.
Vallejo: Well, a lot of the time, our data analytics work is a numbers game. The important question is, which numbers? When physicians don’t agree with the numbers we’re looking at, I try to step back and explain their relevance from the patient’s perspective or patient care in general. That’s what gets them excited.
The best way to turn off most doctors is just talking about the dollars. Instead, explain how your efforts around the dollars will make it possible to do something they want or to accomplish something important for patient care.
McMahan: Of course we want to be proactive with our data and create a value proposition for clinicians. But the key is how it impacts their workflow. I ask myself, how can I improve how their day goes when they’re in an outpatient clinic? What information can I provide that will help them see the impact of their efforts in the bigger scheme of things—whether it’s financially or on a patient’s experience?
We have become in tune with patient experience. There are publicly reported data on us from the surveys that patients complete. We want to be able to attach the value of the clinicians’ work to the experience the patients have. If you align those two correctly, the financial performance will follow.
Most healthcare organizations are using industry’s model of continuous improvement. That means we should be applying our data to create a value proposition for clinicians that ultimately benefits patients. Clinicians understand the value of things like workflow, and they know that data allows us to plan well. The short answer is, connect the clinician to the data.
Kharabadze: If you do things the right way, the finances will follow. That resonates with how we do things here. When we sit down and look at the data that will drive our decision-making—and by that, I mean the scorecards, dashboards and so on—we never start with the financial data.
There are two takeaways. First, it’s the right thing to do for the business we’re in. And second, if you focus on the data that will help you take good care of patients, provide them with good experiences and empower clinical teams to do the right thing, the financial part will come.
Think of predictive analytics as fuel for continuous improvement
Kharabadze: Predictive analytics can be powerful for both business and clinical decision-making. Share an example where you’ve used predictive analytics—where you looked at what happened in the past, figured out the reasons why and then predicted what might happen in your service line.
Vallejo: When I think about the big projects we have undertaken to improve data capture, the biggest impact has been achieving uniformity. We recognized that we needed to get people on the same page, make sure the various service lines were represented and confirm all of the right people were in the room. And then we had to actually draw the flow diagrams and figure out what we were doing successfully and where we needed improvement. That’s especially important when you have several locations and everybody’s using the EMR. Are we programming it appropriately and then educating everybody—don’t forget the residents and medical students—who comes through?
For the project I’m thinking of, it took some time to get there, but ultimately it went very well. We learned that we were doing the right work, but everyone was documenting it a little bit differently—for example, putting it into a different field.
One of the great results was that, once we got it ironed out, it became something we all just do. We don’t need to even think about it anymore.
Sivagnanam: We have a team looking at clinical pathways and predictive analytics for heart failure readmissions. The project involves many different players in patient flow, care coordination, outpatient clinics and, of course, the advance heart failure team. They’re trying to identify the markers associated with readmissions so we can predict which patients are vulnerable for readmission. The goal, obviously, is to use those data to ensure they receive appropriate follow-up and help them avoid having to come back to the hospital.
McMahan: There are three things related to our outpatient or ambulatory clinics that have enabled us to achieve greater precision with what we report and share. First, looking at future slots in our scheduling system enables us to understand what our staffing needs will be so we can strategically position the right resources at the right location at the right time and have the right number of rooms available so our physicians can see their patients in a timely manner. In other words, we look ahead, see what we’ve got and react to it.
Second, do we have enough access? Can we get our patients in the door? We look at the number of outpatient appointments in any given day and confirm that it meets a threshold sufficient to satisfy the demand for services.
Third was identifying tools that allow us to determine which clinicians are in clinic on a given day. With precision around that, we can ensure that physicians get the dedicated time they need for research without leaving scheduling gaps.
With the help of IT experts, you can build tools and dashboards that inform how you move forward in areas like these. Are the blocks scheduled so the rooms turn over at the right time and the right clinicians are available for the patient population that will be coming through? You’re making sure all of the variables fit together to get you where you want to go. And it truly is all based on where you’ve been. You know what you’ve done historically and what you need to do going forward, which allows you to use predictive analytics to strategically plan how to achieve your goals.
Kharabadze: At Yale, we’ve begun getting into this domain by predicting things like infection rates and lengths of stay. By predicting these clinical variables, we think we’ll be able to close gaps in other parts of the continuum of care, such as case management.
As we’ve all seen, our ability to predict gives us tools to change the course and then close the circle and begin again. Dashboards are never static. The metrics change, the benchmarks shift. As we improve, we get more aggressive with our goals. What is your organization’s culture around continuous improvement based on data analytics?
Vallejo: Years ago, our continuous improvement process was rolled out in several of our clinical areas and it then cascaded over to the hospital, which is not part of our organization. It moved our culture to one of change and process improvement, which is now reflected in our policies and procedures.
Years later, I see process improvement playing out at both the medical school and the hospital because one group influences the other. It makes sense that it flows because patients go both ways. Being on the same page has helped both organizations financially, too.
McMahan: We started several years ago in specific areas, such as a procedural area on a hospital floor or in an outpatient clinic. We began by using visual management tools. We took the data and reported them in a forum where all the key stakeholders were gathered around a whiteboard or received handouts.
Since then, we’ve migrated away from visual management tools on a wall or computer to visualization tools that let us bring up our statistics and see them in different ways.
We’ve also gone to the huddle process, where at the beginning of each day I send out a report on what we’re looking at that day. It gets reported up to each level, so everyone knows. There are no surprises because everything is transparent and is communicated in as close to real time as possible. That way everyone is focused on what they can do better, what needs to improve, how it impacts the patient and the caregiver. It’s a continuum that continues to elevate performance and a culture that we built over time.
 Select goals that clinicians will embrace as opportunities to excel
Kharabadze: “Professionals tend to resent the imposition of goals that may conflict with their vocational ethos in judgment.” That's another observation from Jerry Muller, writing in The Tyranny of Metrics. With that idea in mind, share how your organizations set goals and select metrics.
McMahan: When we think about goal-setting, we tend to look to our CEO to set direction. We have a process called objective key results, or OKR, which has been in the literature for some time. Our OKRs fit into different categories—for example, financial performance, patient experience, quality of care, access to care and diversity.
As we look at the OKRs, we use the data available to us in each key area. There isn’t a provider in the world who would argue with quality metrics. That is helpful because it becomes something that isn’t resented but rather is a challenge for them to excel at what they do. So, we set those quality goals and then we work toward them, knowing they will be publicly reported. Or, with patient experience goals, we all have surveys. We use them as tools that provide feedback and national benchmarks while challenging us to reach for excellence.
You might get resistance if you focus only on the financial side of the house. Finances are important but, as we stated earlier, with clinicians you want to focus on goals where they can see their direct impact, where they could even become the benchmark for their peers in the field.
Vallejo: That covers it, but I’ll add that it’s important to look at all of your physicians’ contributions, including research and teaching, when setting goals. Your goals—and the metrics for tracking them—should reflect all of the components of the service line. When you exclude some activities from the goals, you risk turning off the physicians who do most of their work in those areas. Conversely, when you include those components, you contribute to their satisfaction.
Kharabadze: Right, not everyone will have the same reference point in terms of academics, research, education and so on. It’s important to titrate the data to the specific geography, circumstances or patient population.
Sivagnanam: With data and dashboards, we must collaborate with our physicians, make sure there’s follow-up and ensure it’s done frequently. Sometimes we’re guilty of showing them a dashboard and then not coming back with another for three months or even longer. Or we don’t follow up on the data we sent out to actually explain what each metric means and the rationale behind it. We shouldn’t expect they will agree on every point, but if you do it long enough, share it in the right forums and review it regularly, you’ll get more buy-in eventually. It needs to become part of their daily work but not get in the way of their clinical work.
Mine your registry data for new opportunities
Kharabadze: In the cardiovascular arena, there are numerous registries, some of them quite robust. Many of these registries are required by an accrediting party or a federal mandate. We’re told we must participate in a registry, but how we use the data from it often is not specified. How are you using registry data?
McMahan: For us, the key is reporting our results to an outside body, so we know there’s no bias. The comparative statistics help us find out how we are doing against other organizations that are performing the same procedures or caring for the same types of patients.
Internally, registry data help us shape our decision-making; provide opportunities for research; and reveal common threads, such as around a treatment protocol or surgical procedure, that could lead to better outcomes.
Vallejo: The registries can help you gather information to inform your participation in clinical trials or other opportunities. The data might suggest areas where we could push the envelope with a service we already offer—a push to become the best. It impresses patients when they come into clinic and we talk to them about participating in a study or trial. Having registry data can present new opportunities.
McMahan: I agree. It’s a competitive market, and the registries help industry and other sponsoring groups to search you out.
Start small, start smart
Kharabadze: Now, we are looking for brief, from-the-gut answers to a few lightning-round questions. First, imagine a world where you could have only one metric, or one category of metric, to judge where you stand in your current scope of responsibility. Which metric would you choose?
McMahan: It can’t be just one. There’s so much out there.
Sivagnanam: One is impossible.
Kharabadze: OK, I’ll rephrase. You can have just one leading indicator. Which one?
McMahan: I’m thinking dollars or RVUs, but quality is huge.
Vallejo: Right. And if I master quality, or a key metric in quality, everything else will take care of itself.
McMahan: Yes, I agree. Sivagnanam: Yes, a quality-related metric.
Kharabadze: I think I would look at my patient experience scores. I know patients don’t always get to choose where they go for care, but if I consistently see those scores in the top decile, that gives me comfort. I know we wouldn’t be in that zone if we weren’t taking good clinical care of them or if they were getting the wrong bills.
Here’s another aspirational question. What is the one piece of advice you would offer to someone who has just been given responsibility for a cardiovascular service line’s data analytics and doesn’t know where to start?
Vallejo: Get with your leadership. They will provide the vision for where you want to go and what kind of institution you’re aiming to have. Whether you are new or have been around for a while, your leadership will tell you where you need to be going.
As a leader myself, I see it as my responsibility to provide information so we all can make informed decisions.
Sivagnanam: I would say direction. There’s so much data available and so much more you can collect, but don’t put out data just for the sake of putting out data. We all have done that, but my advice is make sure whatever you’re measuring and collecting is directing you toward a goal.
McMahan: I’d add that you need a physician champion no matter your area or level. Your physician champion will help you set the direction and the course. There are all kinds of metrics, but someone needs to say, this is where we’re going to start, so let’s see where the path takes us.
Kharabadze: My first thought was, do something. Anything is better than procrastinating.
So, pick something with the potential to improve patient care. I have found that some of the most helpful information comes from the verbatim comments in the patient experience surveys. Go through 12 months of surveys and read what your patients say is frustrating or upsetting them. Find the common themes, the biggest bucket of frustration for cardiovascular patients, and start there.
 The related advice is to start small. Take on a small project first. Once you have one success, it will lead to another, bigger success, and so on.
Remember, some things aren’t quantifiable
Kharabadze: Last question: Do you think that people in our positions who are the administrative leaders of service lines and have a lot of data-oriented responsibility need to love working with data?
Vallejo: I suspect most of us on this roundtable do love data, but I don’t think it’s required. You just need to be informed about what you’re looking at and be able to connect the dots.
Sivagnanam: I don’t think so either. Don’t ever forget that we work in healthcare. We will always need human interaction, human touch, clinical expertise. Data is very important. It’s the backbone of decision-making, but we still need to collaborate and communicate with all of our stakeholders. Data doesn’t show what’s behind the scenes. It may show a high-level decline in one thing or an increase in another. Those are useful things to know, but it can’t replace human conversation. Go talk to people and really validate what you’re seeing in the data. It’s important to continually make time to do that.
Kharabadze: That’s a great point. How we’re making someone feel is impossible to quantify.
McMahan: We have a quote on a wall here that reads, “A patient is not an interruption to the day, the patient is the reason we are here.” There are all kinds of risks that we can talk about related to data but, at the end of the day, it is physical touch and emotional connections with patients that will set the tone for how they heal.
We can get all the data points right, but if they don’t emotionally connect with us, it can affect their whole experience in the hospital or in the clinic or even their whole recovery.
See the related article: Oasis of Opportunity: Strategies for Managing Healthcare’s Data Deluge

Kathy joined TriMed in 2015 as the editor of Cardiovascular Business magazine. She has nearly two decades of experience in publishing and public relations, concentrating in cardiovascular care. Before TriMed, Kathy was a senior director at the Society for Cardiovascular Angiography and Interventions (SCAI). She holds a BA in journalism. She lives in Pennsylvania with her husband and two children.