
With 80 physicians serving a sprawling network of 40 outreach sites across Minnesota, the Minneapolis Heart Institute (MHI), part of Allina Health, faced a daunting challenge: how to deploy its cardiovascular specialists at the right places at the right times to optimize cost, quality of care and patient outcomes.
After expanding its provider team with eight additional advanced care practitioners (ACPs) over a short time frame, Sanger Heart & Vascular Institute, based in Charlotte, N.C., decided to track not just their performance but their impact on the clinical service productivity of physicians they work alongside and on the ability of the practice to grow opportunities for new patient access.
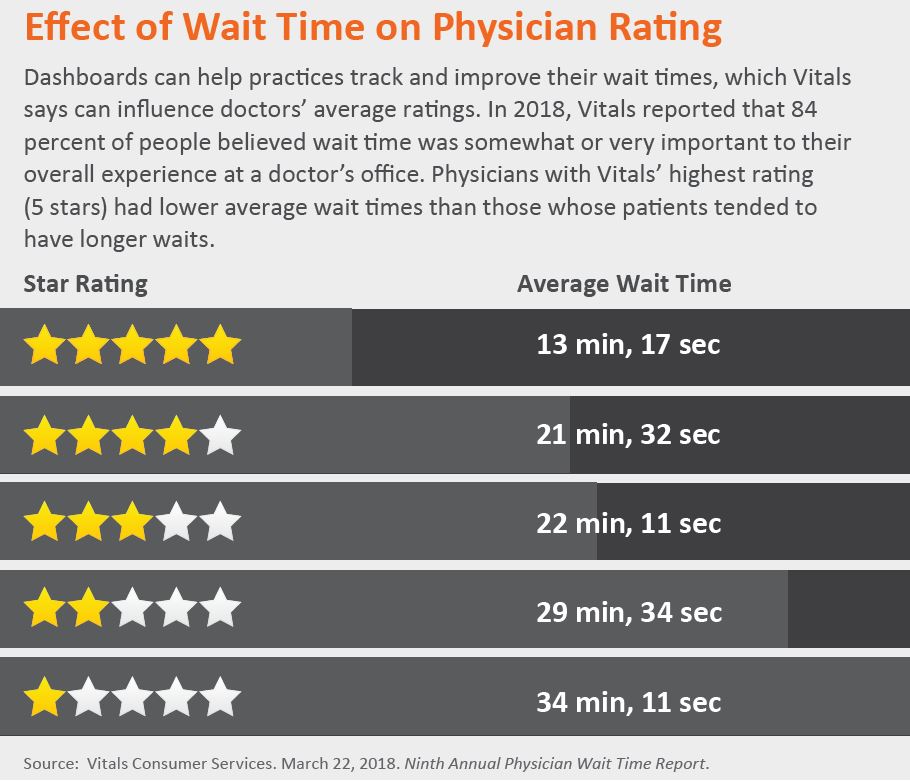
Recognizing the impact of wait times on patient satisfaction—one in five patients will switch providers when forced to cool their heels too long in a physician office, according to Vitals’ Ninth Annual Physician Wait Time Report, Cardiovascular Institute of the South (CVIS) implemented a system that provides alerts on nearly a real-time basis when a wait problem emerges at any of its care facilities.
In each case, the solution was encapsulated in a single highly calibrated tool: a dashboard. While dashboards—which employ key metrics to help users precisely measure and better understand performance as a vehicle to drive improvement—are hardly a new idea, they are enjoying robust growth within healthcare systems and hospitals in an age where quality, outcomes and cost containment are watchwords.

Minneapolis Heart Institute, Allina Health
“Healthcare systems are under tremendous pressure today, and their ability to leverage meaningful data to drive improvements in care and outcomes as well as to optimize financial benefits must be the paramount focus going forward,” says cardiologist Craig Strauss, MD, MPH, who is medical director of MHI’s Center for Healthcare Delivery Innovation and vice president for Quality, Innovation and Advanced Analytics.
Indeed, through the development of some 30 different dashboards that leverage reams of data from more than 75 sources (clinical, cost accounting, payer, patient satisfaction, national registry and benchmark), the healthcare system demonstrated over $50 million in cumulative savings across cardiovascular care from 2013 to 2018. The clinical impact of this vast data enterprise over the past three years is reflected in 3,220 hospital days avoided, 3,330 units of blood saved, 142,194 lab tests avoided, 912 high-risk PCI cases optimized and 1,017 fewer cardiovascular intensive care unit admissions.
Allina’s dashboards sprouted from its initial investment 15 years ago in an enterprise data warehouse; followed by creation of the Center for Healthcare Delivery Innovation, which is run by Strauss and a team of two administrators, four data analysts/data architects; and a collaborative agreement with an outside firm to manage the data warehouse. Administrators consider the ongoing cost of the Center small when weighed against the overall financial benefits to the health system from the dashboards and associated analytics. The outreach dashboard alone—which disperses cardiologists to clinic sites where their services are most urgently needed—has increased the contribution margin per full-time physician day by 18 percent over the past three years.
Cardiology department data dashboards have potential for significant rewards
The benefits of dashboards may seem unassailable, but successfully implementing them across operations and service lines is anything but a slam-dunk. In 2015, the Advisory Board noted, “CV leaders are awash in countless quality, financial and operational metrics; selecting which of those actually make a difference toward achieving a service line’s priorities is no small feat … while gathering the data is one thing, many struggle with how to make it actionable” (online June 9, 2015).
Sanger Heart & Vascular Institute, part of Atrium Health, began mastering the process years ago by building a suite of what is today 12 customized dashboards to measure physician and business performance against benchmarks like 30-day mortality and cardiology readmission reductions, new patient visit growth, patient satisfaction and number of staff per 10,000 work RVUs (relative value units, a measure of the resources required to perform various services in a hospital or clinical department). The latter metric has proven to be a particularly valuable gauge of practice productivity and efficiency, while enhancing both staff and provider engagement to the top decile nationally.
 Tracking the eight ACPs from the time they were hired in 2014 to 2018 with the aid of a customized dashboard showed an increase of more than 140,000 RVUs, or 20 percent. Over that period, only one physician was added to Sanger’s adult cardiology practice of 69 doctors. This growth was mostly attributed to new patient capture associated with greater access to physicians. The incremental patient volume was a major contributor to 88 percent growth in contribution margin for the period.
According to Scott Moroney, vice president of Sanger Medical Group’s administration operations, and Bart Reeves, director of business operations for the institute, who continually populates the dashboards with data from the health system’s burgeoning data warehouse, this feat is persuasive evidence that ACPs were a smart and highly productive investment. “By making the investment on the practice side to bring these eight ACPs onboard, we allowed our physicians to work at the top of their license, which helped the system to almost double the contribution margin at our hospitals,” concludes Moroney. Adds Reeves, “And because we simultaneously monitored and optimized teammate service volume activity across 20-plus clinic sites, we did it with virtually the same number of staff while increasing provider engagement.”
The importance of cardiology department data benchmarking
For David Safley, MD, an interventional cardiologist at Saint Luke’s Mid America Heart Institute based in Kansas City, Mo., and vice president of medical affairs for quality at Saint Luke’s Health System, dashboards deliver an opportunity to “take top-quartile performance and figure out how to tighten up around the edges to make it top-decile performance.” He elaborates, “We all live in a world of limited resources and want to know where we can get the most bang for the buck.”

That has meant designing, building and populating dashboards with data that often originate from outside sources, such as the National Cardiovascular Data Registry’s CathPCI and ICD registries, and the Vizient Clinical Data Base with its strong benchmarking capabilities. “You don’t want to use just internal data,” says Safley. “External benchmarks give you the opportunity to improve against others.”
Heart failure is a case in point. Using a customized heart failure dashboard developed with metrics like patient readmissions and hospital follow-up visits, Saint Luke’s learned that emergency room readmissions were trending higher than desired while visits within a week of hospital discharge were trending lower. The health system’s response was to assign more providers— heart failure nurse practitioners and physicians—to each of its outreach sites in the Kansas City metro area to encourage and better accommodate same-day walk-ins.

For practices straddling the fence over implementing dashboards, Safley advises talking to institutions that already have them. Starting small-scale with one or two dashboards is preferable, he maintains, to “thinking they’re going to have a dashboard for every nook and cranny of their health system.” Even more important to Safley, though, is having at the helm of the effort a “physician champion” who firmly believes in the power of dashboards and is prepared to spread the gospel among the entire practice.
That thought is echoed by Moroney, of Sanger Heart & Vascular Institute. “You need physician and administrative leaders who have a passion for using dashboards and a desire to highlight performance that complements the good clinical work of your organization through sound metrics,” he says. “Dashboards have helped our providers be more engaged than ever before because when they see a scorecard of how well they’re doing, it enhances transparency and awareness, builds trust and fosters excitement around their work.”
Related Cardiology and Radiology RVU content:
VIDEO: The importance of the Physician Practice Information Survey and its impact on radiology reimbursements — Interview with Linda Wilgus, former RBMA president
New metric captures radiologists’ true reporting time for complex cases, potentially enhancing RVUs
Radiology should consider ditching RVUs for a time-based productivity metric, study suggests
Radiologists' on-call workloads have more than doubled relative to ED visits
RVUs vs. TVUs: Are Time Value Units a Fairer Way to Measure Productivity?